Use Finnhub API data with Plotly Library for Python
Technical Summary of Jupyter Notebook for Stock Data Analysis
Setting Up the Environment
- Imports: Essential libraries are imported:
- plotly for interactive plotting.
- pandas for data manipulation.
- jproperties for configuration management.
- finnhub to access Finnhub's API.
- datetime for handling date and time data.
pip install panda plotly jproperties

Requirement already satisfied: panda in /opt/conda/lib/python3.10/site-packages (0.3.1)
Requirement already satisfied: plotly in /opt/conda/lib/python3.10/site-packages (5.22.0)
Requirement already satisfied: jproperties in /opt/conda/lib/python3.10/site-packages (2.1.1)
Requirement already satisfied: setuptools in /opt/conda/lib/python3.10/site-packages (from panda) (67.7.2)
Requirement already satisfied: requests in /opt/conda/lib/python3.10/site-packages (from panda) (2.31.0)
Requirement already satisfied: tenacity>=6.2.0 in /opt/conda/lib/python3.10/site-packages (from plotly) (8.2.2)
Requirement already satisfied: packaging in /opt/conda/lib/python3.10/site-packages (from plotly) (23.1)
Requirement already satisfied: six~=1.13 in /opt/conda/lib/python3.10/site-packages (from jproperties) (1.16.0)
Requirement already satisfied: charset-normalizer<4,>=2 in /opt/conda/lib/python3.10/site-packages (from requests->panda) (3.1.0)
Requirement already satisfied: idna<4,>=2.5 in /opt/conda/lib/python3.10/site-packages (from requests->panda) (3.4)
Requirement already satisfied: urllib3<3,>=1.21.1 in /opt/conda/lib/python3.10/site-packages (from requests->panda) (2.0.2)
Requirement already satisfied: certifi>=2017.4.17 in /opt/conda/lib/python3.10/site-packages (from requests->panda) (2023.5.7)
Note: you may need to restart the kernel to use updated packages
### Technical Summary of Jupyter Notebook for Stock Data Analysis
#### 1. **Setting Up the Environment**Environment
- **Imports**: TheEssential notebooklibraries beginsare by importing necessary libraries:imported:
- `plotly`**plotly** for interactive plotting.
- `pandas`**pandas** for data manipulation.
- `jproperties`**jproperties** for configuration management.
- `finnhub`**finnhub** to access Finnhub's API.
- `datetime`**datetime** for handling date and time data.
#### 2. **Configuration Loading**Loading
- A configuration file is loaded which contains essentialConfiguration parameters likesuch as the API key, the stock ticker (TICKER)`TICKER`), and the plotting template.template are loaded from a property file, enabling easy adjustments without modifying the code.
#### 3. **Data Retrieval**Retrieval
- Using the Finnhub API, the notebook fetches stockStock recommendation trends data is fetched for the specified ticker.ticker Thevia the Finnhub API. This data includesis analyst recommendations (buy, hold, sell, etc.) over a period and isthen loaded into a Pandas DataFrame.DataFrame, including details like buy, hold, and sell counts along with the corresponding dates.
#### 4. **Data Processing**Processing
- **Date Formatting**: TheConverts the 'period' column, which contains the date of the recommendations, is reformattedcolumn from 'YYYY-MM-DD' to 'MMM YY'. to simplify the x-axis labels on plots.
- **Sorting**: TheEnsures DataFrame is sorted by the 'period' to ensurethat the data in the DataFrame is in chronological orderorder, critical for accurate time-series plotting.
#### 5. **Visualization of Analyst Trends**Trends
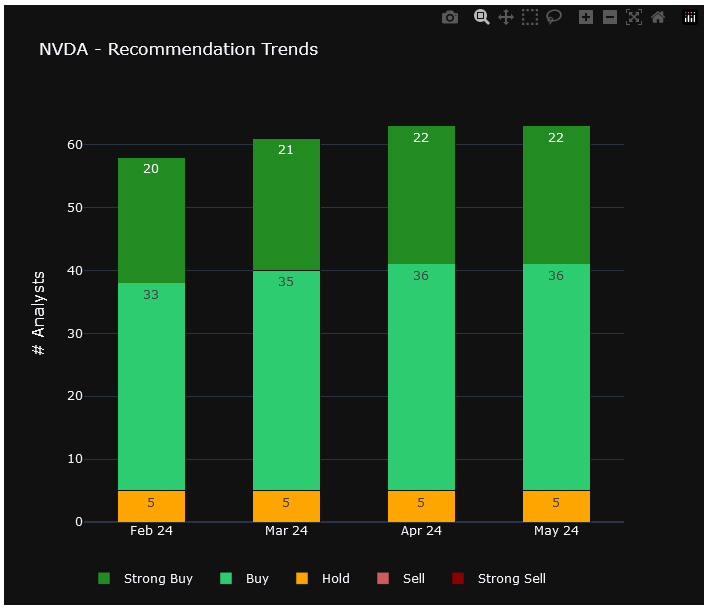
- **Stacked Bar Chart**: TheDisplays dataanalyst isrecommendations visualizedacross different categories using a stacked bar chart,chart. where eachEach category of recommendation (Strong Sell, Sell, Hold, Buy, Strong Buy) is represented by barsdifferent colors.
- **Layout and Style**: Applies a predefined template for style consistency, adjusting elements like font sizes and bar orientation to enhance readability and visual appeal.
#### Rating Computation
- A 'rating' column is introduced, computed as a weighted average of the recommendations, with numerical weights reflecting the strength of each recommendation type. This metric provides a quick, numerical indicator of the analyst consensus.
#### Plotting Rating Scores
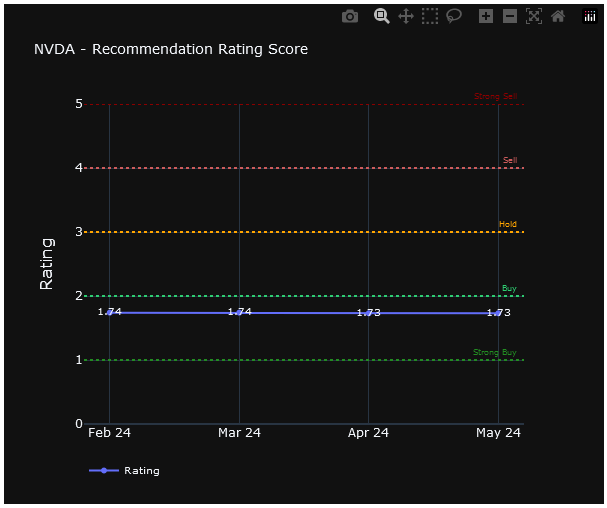
- **Line Chart with Markers**: Plots the computed ratings over time, enhancing interpretability with markers and horizontal lines representing different rating levels.
- **Customization**: The y-axis is fixed to a specific range to standardize the view across different datasets. Annotations and a horizontal legend improve clarity and presentation.
This notebook outlines a methodical approach for fetching and visualizing stock analyst recommendations using Finnhub's API. It focuses on delivering clean and informative visualizations along with efficient data handling techniques suitable for financial data analysis.
Configuration Loading
- Configuration parameters such as the API key, the stock ticker (`TICKER`), and the plotting template are loaded from a property file, enabling easy adjustments without modifying the code.
#### Data Retrieval
- Stock recommendation trends data is fetched for the specified ticker via the Finnhub API. This data is then loaded into a Pandas DataFrame, including details like buy, hold, and sell counts along with the corresponding dates.
#### Data Processing
- **Date Formatting**: Converts the 'period' column from 'YYYY-MM-DD' to 'MMM YY' to simplify the x-axis labels on plots.
- **Sorting**: Ensures that the data in the DataFrame is in chronological order, critical for accurate time-series plotting.
#### Visualization of Analyst Trends
- **Stacked Bar Chart**: Displays analyst recommendations across different categories using a stacked bar chart. Each category (Strong Sell, Sell, Hold, Buy, Strong Buy) is represented by different colors.
- **Layout and Style**: The plot usesApplies a predefined template for consistentstyle stylingconsistency, andadjusting includes configurationselements like font sizes,sizes and bar orientation, and stack modeorientation to enhance readability.readability and visual appeal.
#### 6. **Rating Computation**Computation
- A new'rating' column 'rating'is isintroduced, computed in the DataFrame, which isas a weighted average of the recommendations.recommendations, Eachwith categorynumerical weights reflecting the strength of each recommendation istype. assignedThis metric provides a quick, numerical weight,indicator andof the overall rating is calculated as a weighted average, providing a quick numeric reference to the stock's analyst consensus.
#### 7. **Plotting Rating Scores**Scores
- **Line Chart with Markers**: ThePlots the computed ratings areover plottedtime, againstenhancing the dates using a line chartinterpretability with markers and annotations. Horizontalhorizontal lines are added to representrepresenting different ratingsrating visually, improving the interpretability of the plot.levels.
- **Customization**: The y-axis is setfixed withto a fixedspecific range to maintainstandardize consistentthe scalingview across different plots.datasets. Additional customizations include annotations for clarityAnnotations and a horizontal legend forimprove betterclarity layoutand management.presentation.
This notebook providesoutlines a streamlinedmethodical processapproach for retrievingfetching and visualizing stock analyst recommendations using Finnhub's API,API. withIt a focusfocuses on clean,delivering clean and informative visualizations andalong effectivewith efficient data handling.handling techniques suitable for financial data analysis.


